TL;DR Quick Answers
air quality boston
Boston's air quality index runs 0 to 500 and reports the single worst pollutant in the air right now rather than an average. Ozone drives it through warm months, fine particles all year. At or below 100, the air meets the short-term national health standard. Above 100, sensitive groups feel it first.
Act at 100, not 150. That's the line where the air stops meeting the health standard, and it lands well before you can see haze or smell smoke.
Two pollutants do nearly all the work here. Ozone peaks on hot summer afternoons. Fine particles run year round and spike with Canadian wildfire smoke.
A morning reading goes stale fast. Coastal sea breezes, afternoon ozone buildup, and temperature inversions can move the number sharply within a few hours.
Your indoor air tracks the outdoor number. Air trades through returns, door gaps, and exhaust fans, so what's outside sets the ceiling on what you breathe inside.
Official readings come from two places. AirNow carries the federal monitor data. MassDEP publishes the Massachusetts forecast for ozone and fine particles.
Top Takeaways
100 is the line that matters. At or below it, the air meets the short-term national health standard. Above it, sensitive groups feel it first and everybody else follows as the number climbs.
The number reports the worst pollutant, not an average. In Boston that usually means ozone in the warm months and fine particles year round. Tap the reading to see which one is driving it.
A morning reading can be wrong by afternoon. Heat builds ozone through the day, inversions trap whatever is already sitting there, and wildfire smoke arrives with almost no warning.
Your house isn't sealed against any of it. Outdoor air comes in through returns, door gaps, exhaust fans, and pressure differences, and the concentration inside tracks the reading outside.
Filtration lowers the dose rather than removing it. A clean filter with the right rating matters most on the worst days, and it does the least good once it's loaded.
How the Boston Air Quality Index Is Built
The index tracks five pollutants: ground-level ozone, particle pollution in two size classes, carbon monoxide, sulfur dioxide, and nitrogen dioxide. Two of them do nearly all the work in Boston. Ozone runs the number up through the warm months, and fine particles, the ones small enough to travel deep into your lungs, keep working all year.
Here's the part almost every beginner gets backwards. That number reports the single worst pollutant at that moment rather than averaging the five, translated onto a shared scale so you can compare a smoke day against a smog day without doing any math. A reading of 96 might be almost entirely ozone while everything else sits near the floor. Knowing which pollutant is driving the number tells you a great deal more than the number by itself, and any monitoring tool worth using will show you when you tap the reading. MERV 8 pleated HVAC furnace air filters can then help address airborne particles indoors when particulate pollution is the concern.
Reading the Six Categories Without Memorizing Numbers
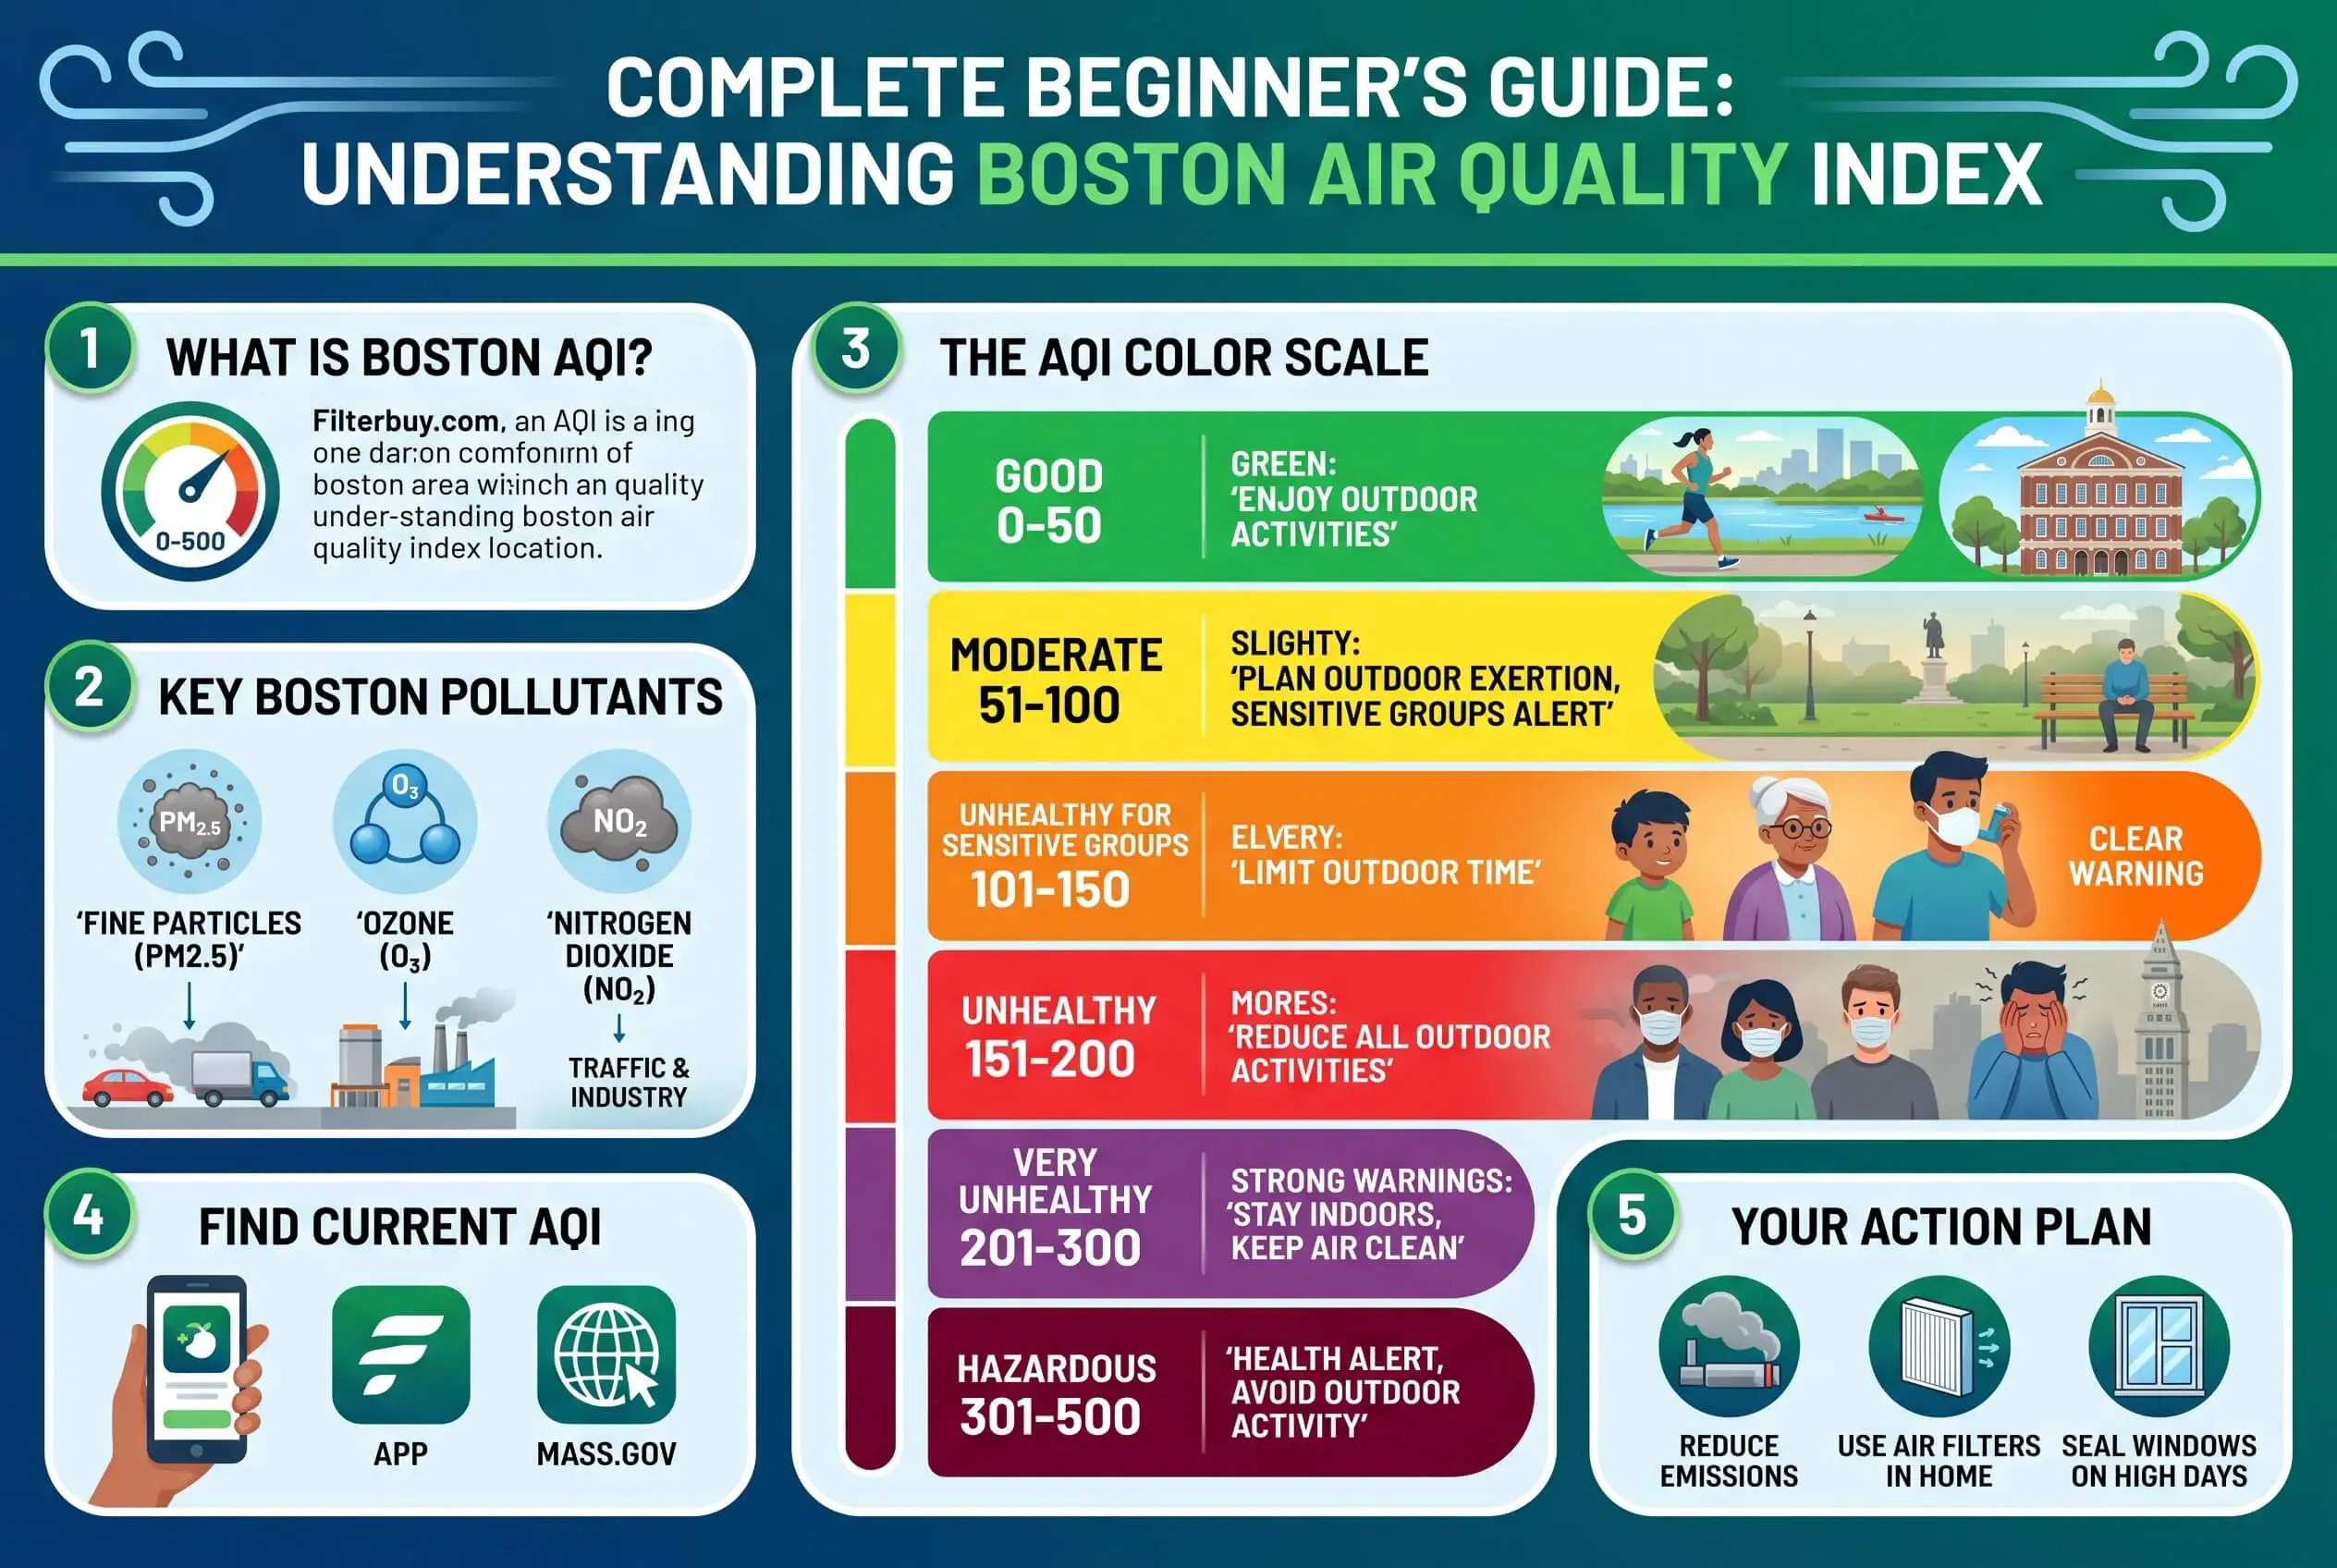
The scale runs 0 to 500 and breaks into six color-coded bands. Forget the boundaries. What you need is what each band asks of you.
0 to 50, Good. Change nothing. Open the windows and air the house out while you've got the chance.
51 to 100, Moderate. Most people feel nothing at all. If you've got asthma or rough seasonal allergies, notice how a long outdoor effort feels and cut it short if you need to.
101 to 150, Unhealthy for Sensitive Groups. Windows close. Move your system fan from Auto to On so it keeps filtering between heating and cooling cycles. Kids, older adults, and anyone with a heart or lung condition should take it easy outside.
151 to 200, Unhealthy. Everybody scales back outdoor exertion now, not just sensitive groups. Check the filter in your return before the day loads it up further.
201 to 300, Very Unhealthy. Stay in, run the fan continuously, and skip anything that adds indoor smoke, candles and unventilated gas cooking included.
301 and up, Hazardous. Rare in Boston, and handled as an emergency when it does happen. Follow whatever guidance the state issues that day.
If one line from this section sticks, make it this one. At or below 100, the air meets the short-term national health standard. Above 100, it doesn't.
Why Boston's Air Changes Hour to Hour
Geography explains more of this than anything else. Boston sits in a low coastal basin of rolling hills at the edge of Massachusetts Bay, with prevailing winds blowing offshore and a shoreline that behaves nothing like the neighborhoods a few miles inland. A late-spring sea breeze can drop coastal temperatures more than twenty degrees below inland readings around midday. Air that moves that hard moves pollution with it.
Three other forces push the number around on a given day. Heat builds ozone, so summer readings climb through the afternoon and settle back overnight, which is how a single day goes. Good at breakfast and Moderate by four. A temperature inversion puts a lid of warm air over the cooler air near the ground and holds whatever's already down there instead of letting it scatter. Wildfire smoke out of Canada travels a thousand miles and resets the whole picture in an afternoon.
So treat a citywide number as an approximation. Your block may not match it, and a nine a.m. reading can say almost nothing useful about five p.m. Look twice on the days that matter.
What an Outdoor Reading Means for the Air Inside Your Home
This is where the number stops being trivia and starts being your business. Your house isn't sealed. It trades air with the outdoors every minute of the day through the return side of your heating and cooling system, through gaps around doors and older windows, through bathroom and kitchen exhaust fans, and through plain pressure differences between inside and out. When the outdoor reading climbs, the concentration inside follows it with a lag.
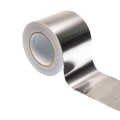
Filtration cuts that concentration down. It won't eliminate it, and anybody who tells you otherwise is selling you something. On an elevated day, a clean filter with the right rating against a gray one that's been sitting in the slot since spring is the difference between meaningfully cleaner indoor air and a system that's mostly moving the problem from room to room. Aluminum foil tape for HVAC systems can help seal accessible duct joints and reduce unwanted air leakage that works against that filtration. That reduction earns its keep exactly when the outdoor number is at its worst.
Which is the argument for checking before you act instead of after. If you want one place to look, a live Boston AQI map you can check before you go outside shows you where the reading sits right now, and that reading is the input every decision in this guide depends on.
A Simple Daily Routine for Checking Boston Air Quality
You don't need a system. You need a fifteen-second habit.
Pick one source and bookmark it. Hopping between tools hands you different numbers and teaches you to distrust all of them.
Check it at the same point in your morning, hooked onto something you already do. Coffee works.
Know your one threshold. For most households that's 100. Past it, windows close and the fan goes to On.
Know what your filter looks like right now. Hold it up toward a light. If light won't pass through, airflow is already restricted and that filter has nothing left to give you on a bad day.
Look twice on hot afternoons and on any day smoke shows up in the forecast. Those two conditions turn a morning reading stale fastest.
"After a smoke event, the tell isn’t how much a filter caught. It’s what the loading looks like. Ordinary household dust builds up as a fuzzy gray lint across the face of the pleat, but wildfire particulate leaves a flat brown film down inside the folds, and when I see that film I know the fraction fine enough to pass through and reach the far side with it."
7 Essential Resources
Start Here If You’ve Never Read an AQI Number Before
The federal explainer on how current, forecast, and NowCast readings differ from each other. This page settles the three-apps-three-numbers problem, and it's the first thing I send people who ask why their phone and their neighbor's phone disagree.
Source: AirNow, U.S. Environmental Protection Agency. https://www.airnow.gov/aqi/aqi-basics/using-air-quality-index/
See Every Monitor Around Boston on One Interactive Map
This mapping tool plots the individual monitoring stations with hourly readings, so you can watch how much conditions shift across the metro instead of trusting one citywide figure to describe your street.
Source: U.S. Environmental Protection Agency. https://gispub.epa.gov/airnow/
Get the Forecast Written Specifically for Massachusetts
The state forecasts ozone from April through October and fine particles all year, plus open burning advisories in spring. This is the local forecast that the national tools are summarizing secondhand.
Source: Massachusetts Department of Environmental Protection. https://www.mass.gov/air-monitoring-in-massachusetts
Connect the Air Data to Local Health Outcomes
The state public health tracking portal ties pollutant data to health indicators across Massachusetts communities. Worth your time if somebody in the house has asthma, COPD, or a heart condition.
Source: Massachusetts Environmental Public Health Tracking. https://matracking.ehs.state.ma.us/Environmental-Data/Air-Quality/index.html
Understand What Ozone and Particles Do Inside the Body
A clear account of why ozone inflames the airways, why fine particles cross into the bloodstream, and which groups carry the most risk. Good context for deciding how seriously to take any given reading.
Source: Centers for Disease Control and Prevention. https://www.cdc.gov/air-quality/about/index.html
Check How the Boston Metro Scored This Year
The annual report grades the Boston, Worcester, and Providence metro on ozone and on both measures of particle pollution, with county-level detail sitting underneath the headline grade.
Source: American Lung Association. https://www.lung.org/research/sota/city-rankings/msas/boston-worcester-providence-ma-ri-nh
Download the Plain-Language Guide and Put It on the Fridge
A printable booklet covering the index and the health effects of each major pollutant. I recommend this one for households where more than one person needs the thresholds in their head without asking.
Source: AirNow, U.S. Environmental Protection Agency. https://www.airnow.gov/publications/air-quality-index/air-quality-index-a-guide-to-air-quality-and-your-health/
Boston’s air quality resources make it easier to track AQI, compare local monitor readings, understand health risks, and plan around pollution events, with regular HVAC system maintenance helping your indoor system respond more effectively when outdoor air worsens.
3 Statistics
Massachusetts Runs a 26-Station Monitoring Network
The state operates 26 air monitoring stations.
Placement favors areas with higher pollution levels and higher asthma rates.
One recent year brought six days of unhealthy ozone, four in June and two in August.
The same year brought four days of unhealthy fine particle levels, driven mostly by Canadian wildfire smoke.
Source: Massachusetts Department of Environmental Protection. https://www.mass.gov/news/massdep-launches-two-new-air-monitoring-stations
The Metro's Daily Particle Grade Dropped to Failing
The Boston, Worcester, and Providence metro fell from a C to an F for daily fine particle pollution.
That moved the metro to 53rd worst in the nation, down from 114th.
170,025 Massachusetts children live with unhealthy levels of air pollution.
Year-round particle levels went the other direction and hit their best passing grade on record.
Source: American Lung Association, State of the Air 2026. https://www.lung.org/media/press-releases/fy26-sota-massachusetts
The Scale Runs 0 to 500 and One Number Carries the Weight
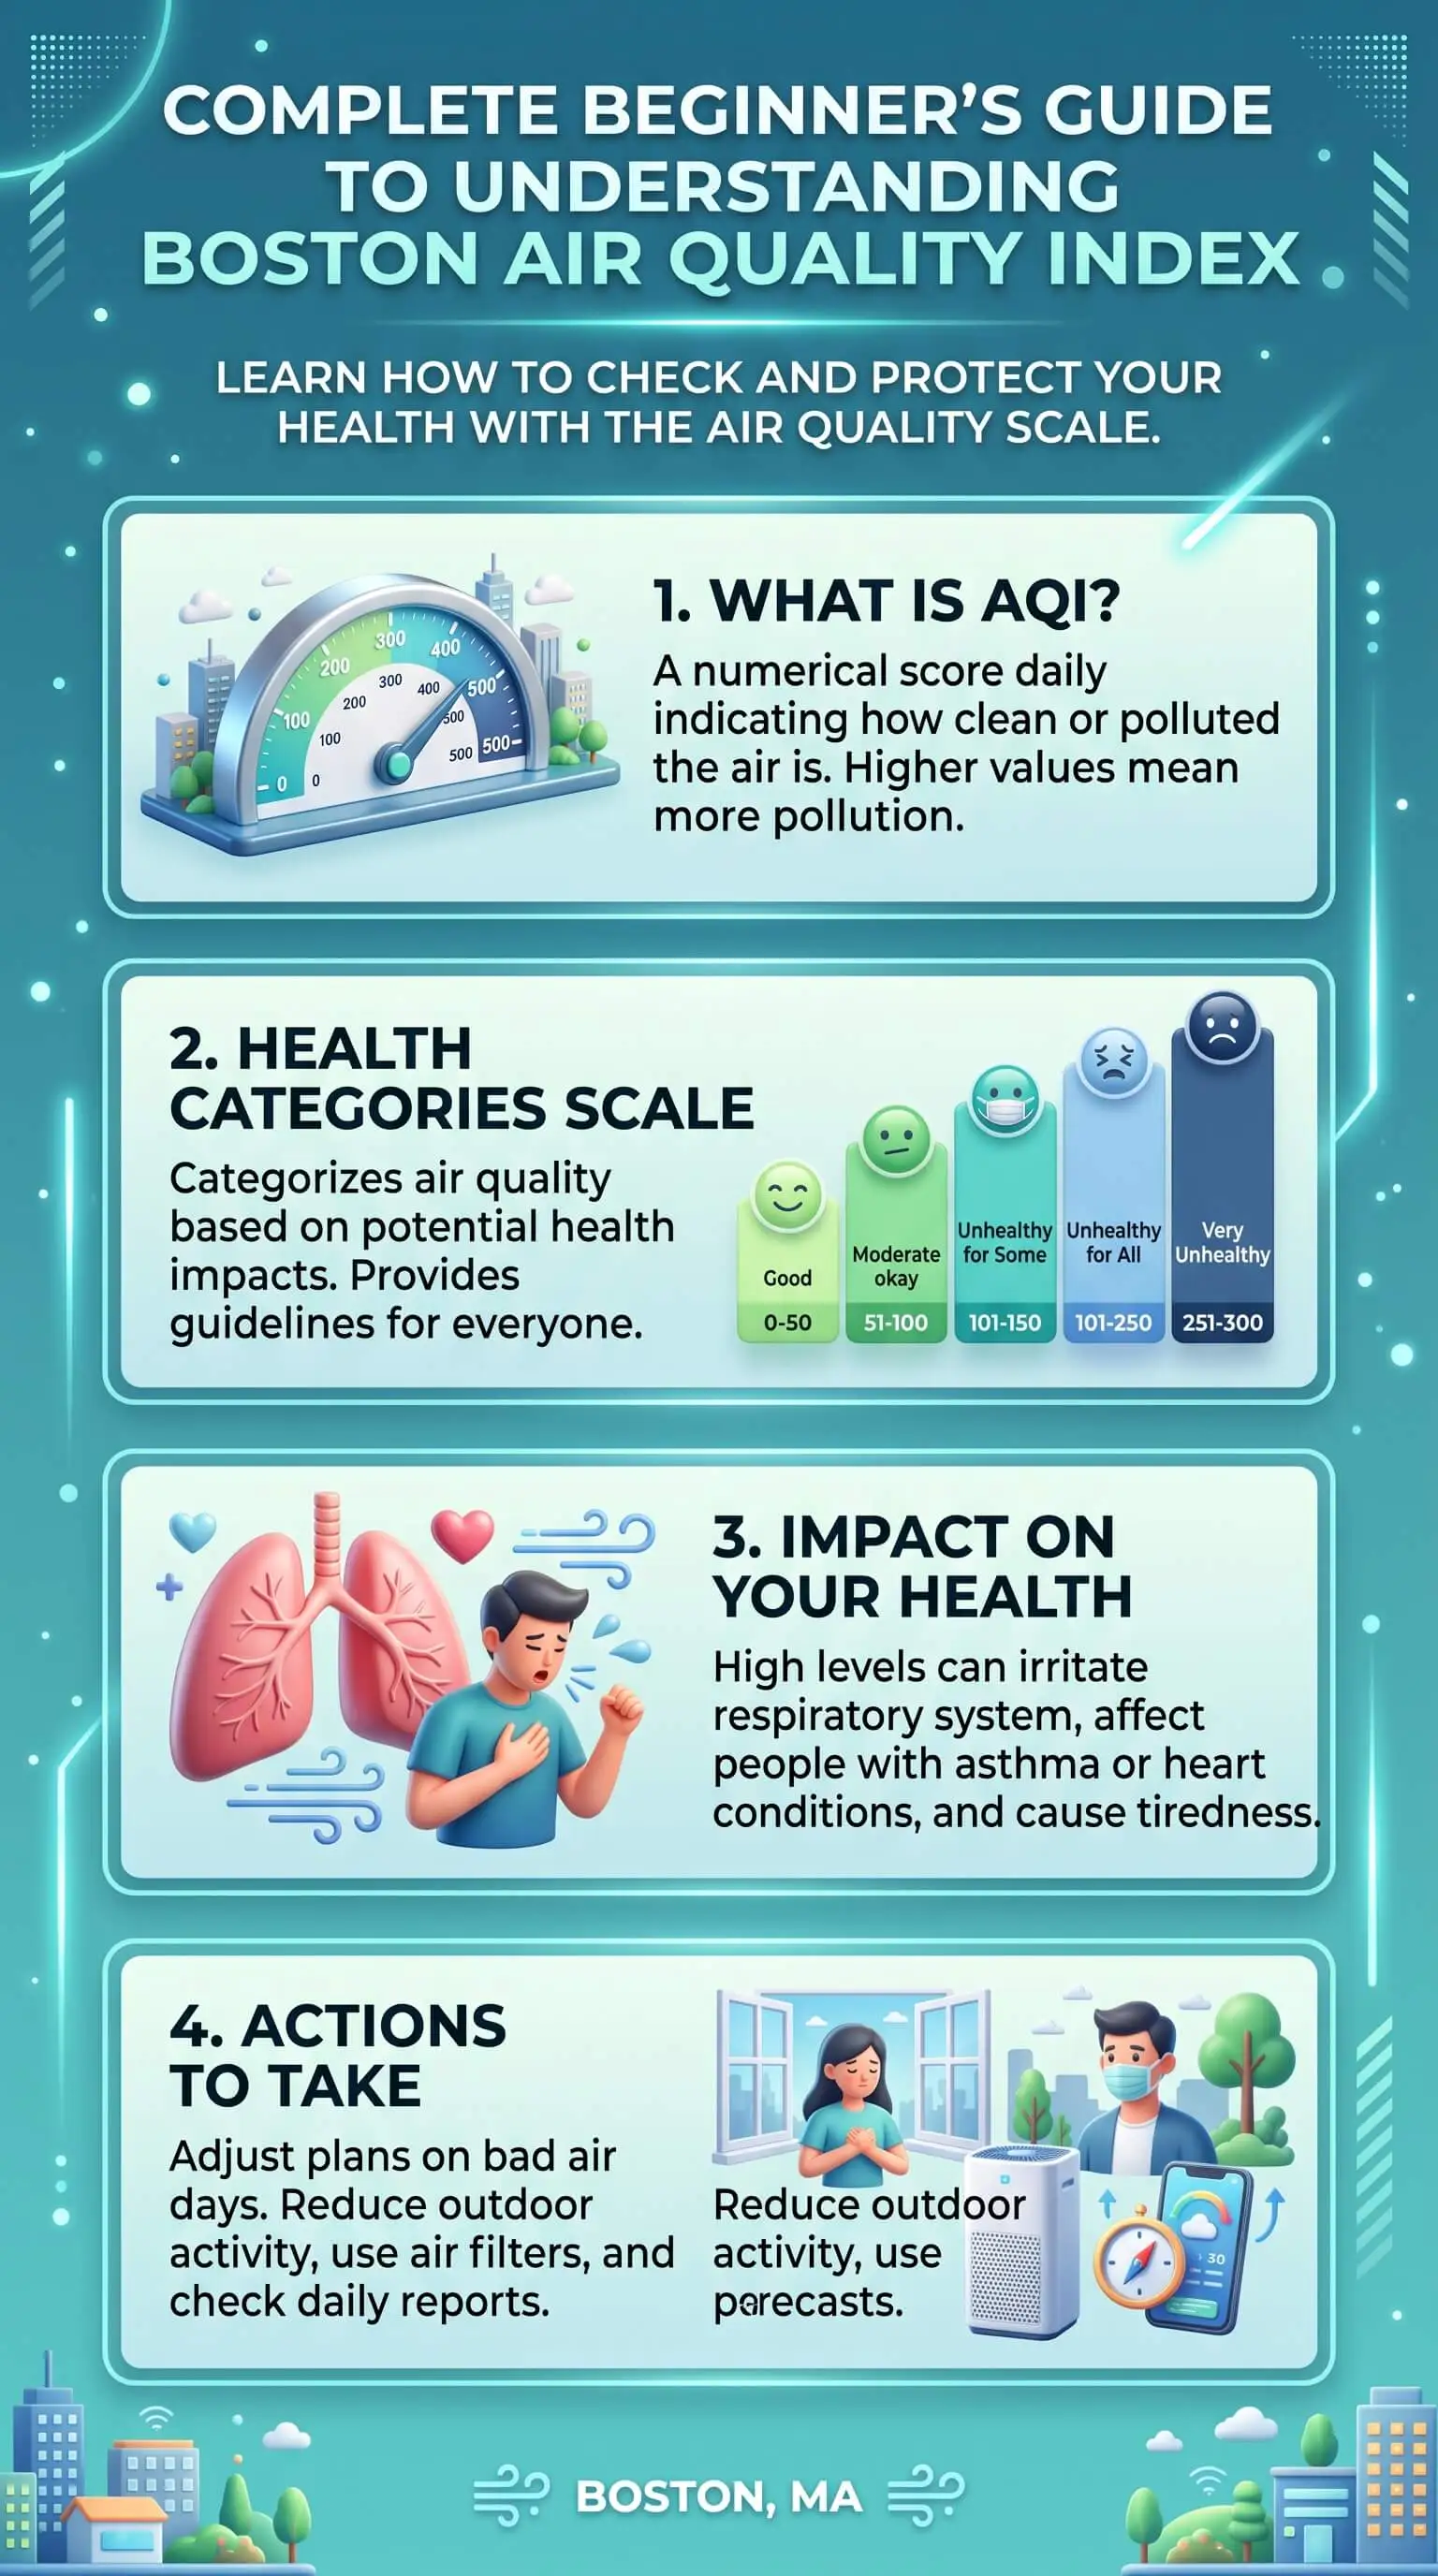
The index is a 0 to 500 scale divided into six color-coded categories.
A reading of 100 corresponds to the short-term national health standard for that pollutant.
At or below 100 counts as satisfactory.
Above 100, the air turns unhealthy for sensitive groups first and for everybody else as the number climbs.
Source: AirNow, U.S. Environmental Protection Agency. https://www.airnow.gov/aqi/aqi-basics/
Boston’s AQI can shift with ozone, wildfire smoke, and fine particles, so pairing regular monitoring with high quality filters helps support cleaner indoor air when outdoor pollution levels rise.
Final Thoughts and Opinion
Here's my honest opinion after years of looking at what comes out of return vents. Most people treat the air quality index like a weather number, something to glance at and forget, when it works far more like a thermostat setting that ought to change what you actually do. If a reading has never once changed a behavior in your house, checking it is a ritual rather than a habit.
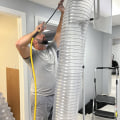
The other thing I'll say plainly, because the filtration business doesn't always say it. Filtration has a ceiling. No filter stops outdoor pollution from reaching you, because your house breathes and sealing it off completely isn't possible. What good filtration does is lower the dose. On the handful of days a year when Boston air genuinely turns bad, lowering the dose is worth a great deal. On the other three hundred, it's quiet insurance. Duct cleaning can support that indoor effort by removing built-up dust and debris from the system. Both of those things are true at once, and I'd rather you hear that from me now than work it out for yourself in the middle of a smoke event.
Frequently Asked Questions
What is a good air quality index number for Boston?
Anything at or below 50 lands in the Good band and calls for no adjustment at all. From 51 to 100 the air reads Moderate, which suits most people fine and deserves a second look if you've got asthma or strong seasonal allergies. Once the reading clears 100, treat it as the point where windows close and your heating and cooling system starts filtering continuously.
Why do two apps show different Boston readings at the same time?
Because they're often reporting different things. One shows the current hourly estimate, another shows the day forecast issued that morning, and a third pulls from a crowdsourced sensor two streets over rather than a regulatory monitor. None of them is necessarily wrong. Pick one source, learn what it actually reports, and stop comparing. Consistency will teach you more than a second opinion.
When is air quality usually the worst in Boston?
Two separate seasons, and people only remember one. Ozone peaks on hot, sunny summer afternoons and gets forecast from roughly April through October. Fine particle pollution runs all year and spikes with wildfire smoke, which has been arriving in the Northeast from Canada in recent summers. Winter carries its own particle picture from heating and traffic under inversion conditions.
Does outdoor reading really affect the air inside my house?
Yes, and more than most people expect. Air exchanges constantly through your return system, through gaps around doors and windows, and through exhaust fans, so indoor concentrations track outdoor conditions on a delay. Staying inside all day cuts your exposure compared with a long run outdoors, though it won't remove it. That gap is where the filter in your system does real work.
At what reading should I close my windows?
At 100. That's where the air stops meeting the short-term national health standard, and it lands well before most people notice anything with their own eyes or nose. Waiting until the sky looks hazy or the air smells like smoke means particulates have already been coming into your home for hours. Act on the invisible threshold, not the uncomfortable one.
Do I need a different filter when the reading is high?
A higher-rated filter captures finer particles, including the smoke-sized fraction, and that helps on elevated days. Two cautions before you upgrade. Confirm your system can handle the rating you pick, because a filter too restrictive for the equipment costs you airflow. And the condition beats the rating every single time. A loaded high-rated filter performs worse than a clean moderate one.
From Beginner to Confident With Boston's Air Quality Index
You know what the number counts now, which pollutant usually drives it, and where the line sits between an ordinary Boston day and one that should change your plans. Pick a single monitoring source, check it at the same point tomorrow morning, and pull the filter out of your return while the reading is still Good, so you know exactly what you're working with when it isn't. A properly planned HVAC system installation gives that indoor side a stronger foundation for managing the air your home circulates.